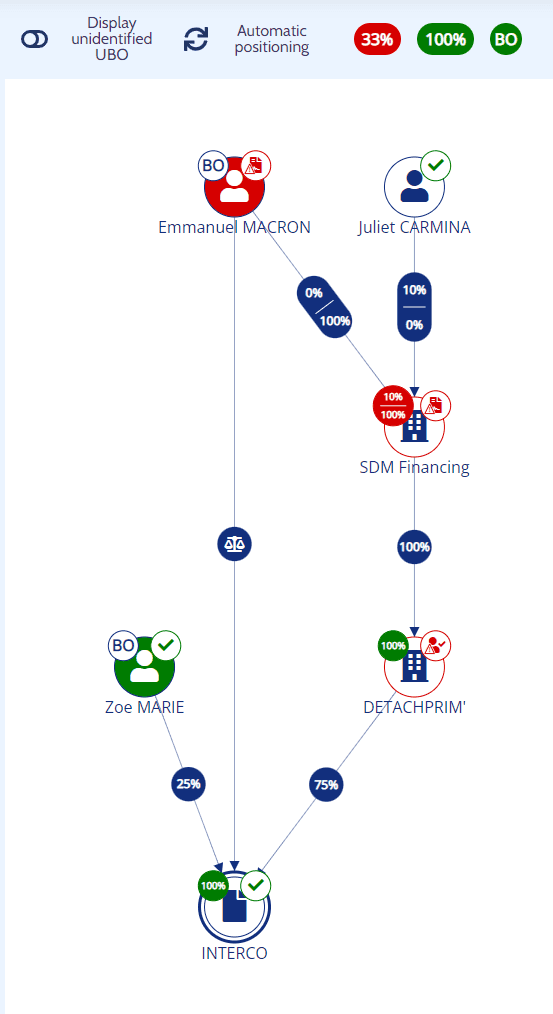
Shareholding graph
The shareholding graph is a modifiable and dynamic representation of the company's capital links, including a detailed and global view of the stakeholders and the beneficial owners.
- Ease of online shareholding entry for clients.
- Strengthens understanding of the customer ecosystem.
- Visualization and automatic detection of beneficial owners.
- Dynamic display of stakeholders.
- Management of third parties and related entities.
- Automatic recalculation of direct and indirect holdings (%).
- Simplified vision of complex shareholders.
- Improves the development of mandatory capital links by the European Central Bank.
- Simple and accessible use for any user.
- Smart iconography and color codes to facilitate graph completion.
Use cases
- Automated customer onboarding
- Internal representation of an IS in the form of a graph
- Representation of entities
- Representation of funds by transparency
- Fleet management
For who?
- Architects
- CIO
- Data owners
- Client onboarding managers
